Project Overview
This project explores the intersection of music preferences and mental health outcomes. In an era where mental health struggles are escalating globally, understanding accessible interventions like music therapy can empower early detection and support. Using Python for data wrangling, visualization, and statistical analysis, I analyzed a survey dataset to uncover patterns in how listening habits correlate with conditions like anxiety, depression, insomnia, and OCD. This portfolio piece demonstrates my skills in data cleaning, exploratory data analysis (EDA), and storytelling with data.
Technologies Used: Python (Pandas, NumPy, Matplotlib, Seaborn, SciPy, Scikit-learn), Jupyter Notebook.
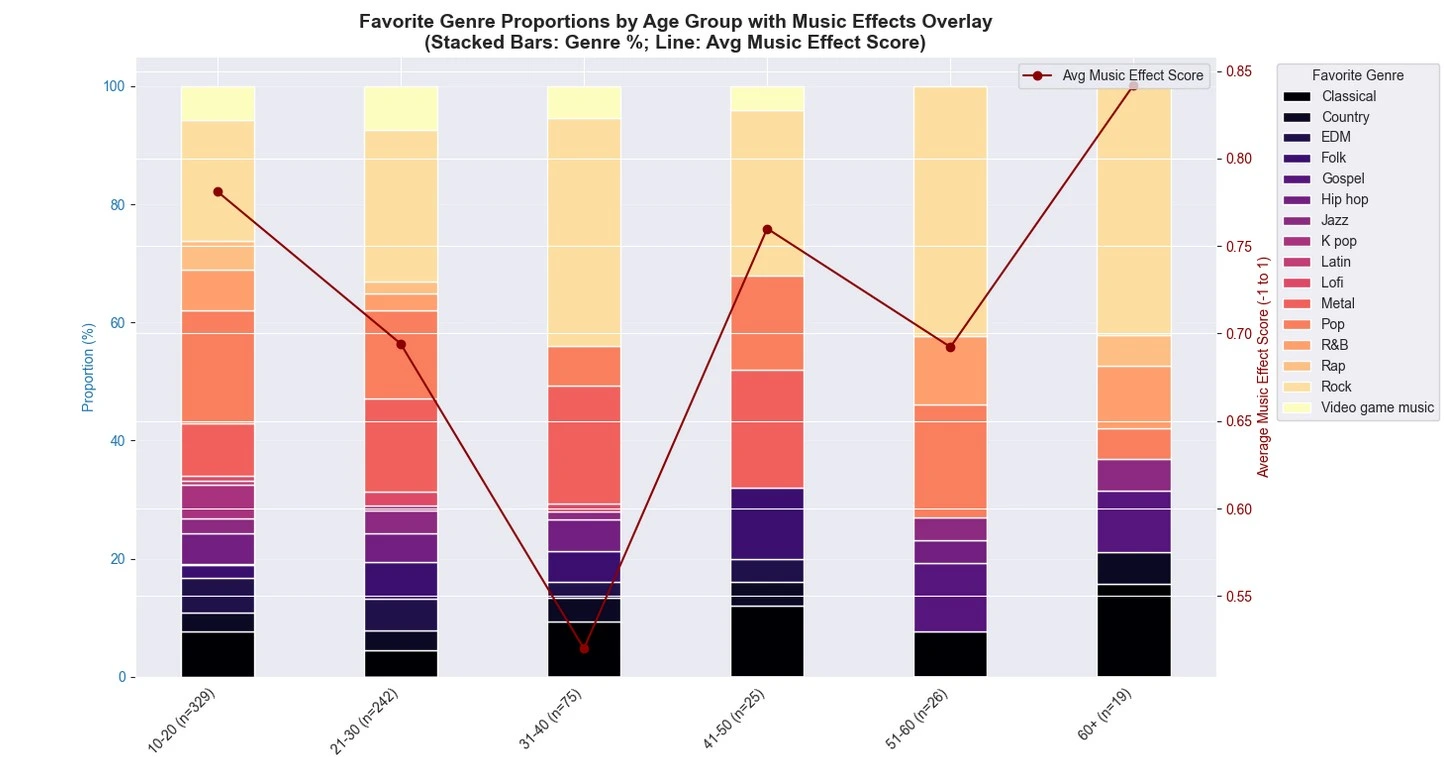
Dataset Source: MxMH Survey Results on Kaggle (736 respondents, 33 columns). Note: The dataset shows an imbalance in sample sizes across age groups, with younger respondents overrepresented (e.g., 10-20 years: 329 samples; 21-30: 242; 31-40: 75; 41-50: 25; 51-60: 26; 60+: 19). This skew may influence generalizability, particularly for older demographics.
The Mental Health Crisis: Why This Matters
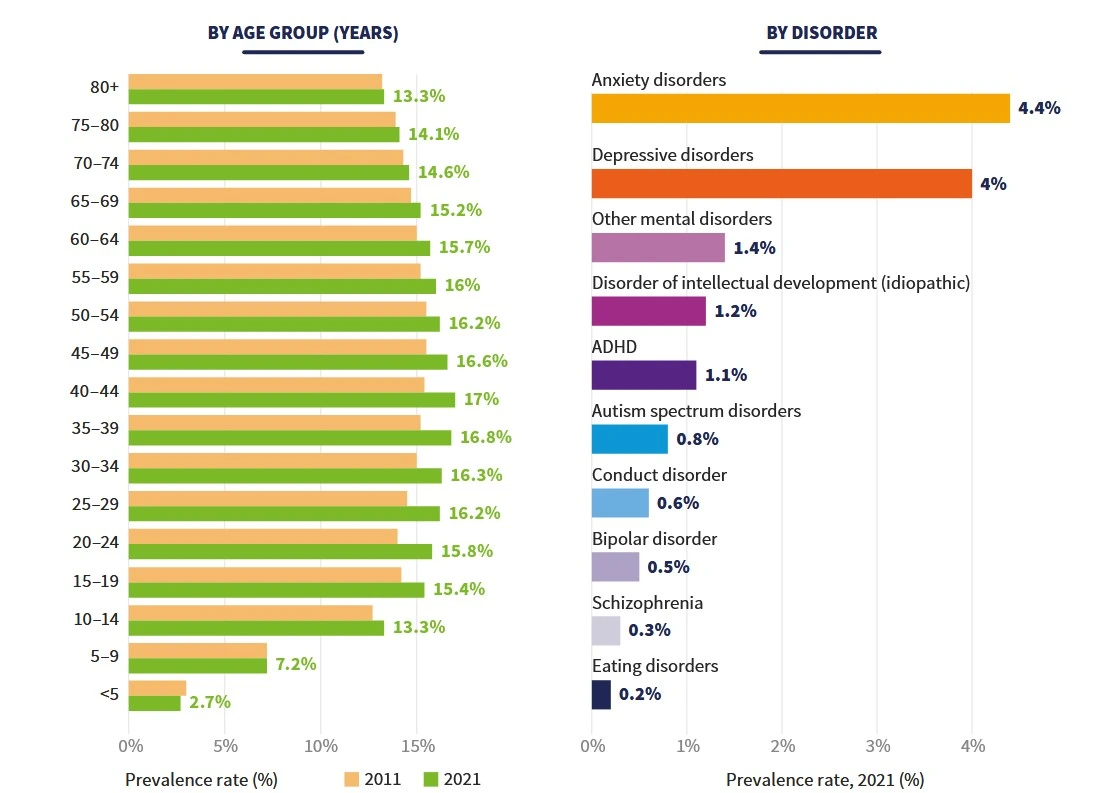
Mental health has emerged as one of the most pressing global issues today. Disorders like depression, anxiety, and insomnia affect millions, often leading to severe outcomes such as suicidal ideation when individuals lack outlets to express their emotions or access timely treatment. According to the World Health Organization (WHO), an estimated 5.7% of adults worldwide suffer from depression, with women disproportionately affected compared to men. Mental disorders encompass a wide spectrum of illnesses, with depression being the most prevalent, exacerbated by factors like social isolation and stigma.
Early detection is crucial for prevention and effective intervention. Mental illnesses are typically diagnosed using validated questionnaires that identify patterns in emotions, behaviors, and social interactions. However, traditional diagnostics can be inaccessible, especially in underserved populations. This is where innovative, non-clinical tools like music come into play.
Music holds profound therapeutic potential. Beyond entertainment, it calms the mind, reduces stress, and fosters emotional release—mechanisms that have shown success in treating various conditions, from anxiety to chronic pain. Research highlights music's role in modulating brain activity, lowering cortisol levels, and enhancing mood regulation, making it a low-barrier entry point for mental health support. For instance, rhythmic listening can synchronize neural oscillations, promoting relaxation and even aiding sleep disorders like insomnia. In this project, I investigate whether survey respondents' music habits (e.g., listening frequency by genre, daily hours) correlate with self-reported mental health scores, potentially informing personalized music-based interventions.
Dataset and Data Cleaning
The dataset captures survey responses from music listeners on demographics, streaming habits, genre preferences, and mental health metrics (Anxiety, Depression, Insomnia, OCD on a 0-10 scale). Key columns include Age, PrimaryStreamingService, HoursPerDay, FavGenre, and frequency of listening to genres like Rock, EDM, and Lofi.
Raw data challenges:
- Missing Values: Key columns had low null counts before cleaning: MusicEffects (8), Age (1), PrimaryStreamingService (1), WhileWorking (3), Instrumentalist (4), Composer (1), ForeignLanguages (4). BPM had 107 missing (14.5%).
- Inconsistent Naming: Columns like "Primary streaming service", "Hours per day", and frequency columns (e.g., "Frequency [Hip hop]") needed standardization for easier manipulation.
- Data Types: Timestamp as string; categorical variables as objects.
- Outliers: Age ranged from 10-89 (plausible but skewed young); HoursPerDay up to 24 (valid extremes); BPM up to >500 (unrealistic, as typical music BPM is 60-200).
- Irrelevant Columns: Timestamp, derived Time, and Permissions offered little analytical value.
Cleaning Steps:
- Load and Inspect: Used
pd.read_csv()to load;df.info()anddf.describe()revealed structure (736 rows, 33 columns; 7 numeric, 26 categorical). - Rename Columns: Standardized for readability and consistency using
df.rename()and regex viaremodule. Examples: "Primary streaming service" → "PrimaryStreamingService"; "Hours per day" → "HoursPerDay"; "While working" → "WhileWorking"; "Fav genre" → "FavGenre"; Frequency columns: Extracted genre names, e.g., "Frequency [Rock]" → "RockFrequency" (and similarly for Classical, Country, EDM, Folk, Gospel, HipHop, Jazz, KPop, Latin, Lofi, Metal, Pop, Rap, VideoGameMusic); "Foreign languages" → "ForeignLanguages"; "Music effects" → "MusicEffects". - Handle Timestamp: Converted to datetime with
pd.to_datetime(df['Timestamp'], format='%m/%d/%Y %H:%M:%S'). Extracted 'Date' (df['Date'] = df['Timestamp'].dt.date) and 'Time' (df['Time'] = df['Timestamp'].dt.time) columns for potential temporal analysis. - Drop Irrelevant Columns: Removed 'Timestamp', 'Time', and 'Permissions' using
df.drop(columns=['Timestamp', 'Time', 'Permissions'], inplace=True)as they provided no substantive insights. - Handle Missing Values in Key Columns: With <10 nulls per column (total ~22 across listed columns), dropped rows with any nulls in critical demographics/habits using
df.dropna(subset=['Age', 'PrimaryStreamingService', 'WhileWorking', 'Instrumentalist', 'Composer', 'ForeignLanguages', 'MusicEffects'], inplace=True). This reduced the dataset to ~714 rows with minimal data loss. - Outlier Detection and Removal: BPM Outliers: Filtered for values >400 using
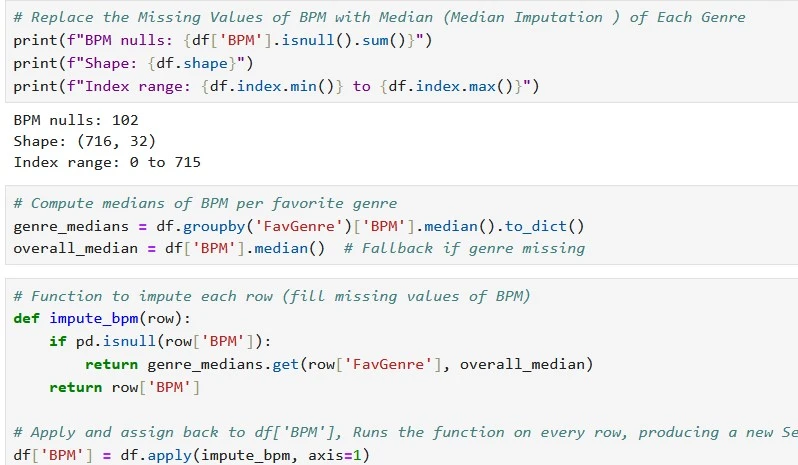
df[df['BPM'] > 400], confirming ~5-10 extreme cases (>500 BPM, implausible for music). Detected broader outliers via boxplot (sns.boxplot(x='BPM')) and IQR method: Q1=100, Q3=140, IQR=40; flagged >200 or <60. Dropped these rows (df = df[(df['BPM'] >= 60) & (df['BPM'] <= 200)]). Other Outliers: HoursPerDay >24 flagged but none found; Age <10 or >100 dropped (none). - BPM Missing Value Imputation: For the 107 remaining missing BPM values (~15% post-outlier drop), performed median imputation grouped by FavGenre using
df['BPM'].fillna(df.groupby('FavGenre')['BPM'].transform('median'), inplace=True). This genre-specific approach preserved contextual accuracy (e.g., median BPM for Rock ~120, EDM ~128). - Categorical Encoding Prep: Applied LabelEncoder to select categoricals (e.g., PrimaryStreamingService, FavGenre) for future correlation matrices:
le = LabelEncoder(); df['PrimaryStreamingService_Encoded'] = le.fit_transform(df['PrimaryStreamingService']). - Age Grouping: To address imbalance and facilitate analysis, binned Age into groups:
df['AgeGroup'] = pd.cut(df['Age'], bins=[0,20,30,40,50,60,100], labels=['10-20', '21-30', '31-40', '41-50', '51-60', '60+']). This enabled crosstabs like exploratory behavior by age. - Warnings Suppressed:
warnings.filterwarnings('ignore')for clean output.
Post-cleaning: Dataset refined to 716 rows (after drops/imputations); dtypes optimized (e.g., categoricals to 'category'); ready for EDA with improved integrity.
Exploratory Data Analysis: Key Findings
I focused on demographics, listening habits, and mental health correlations. Visualizations used Matplotlib/Seaborn for distributions and crosstabs.
Demographics and Habits
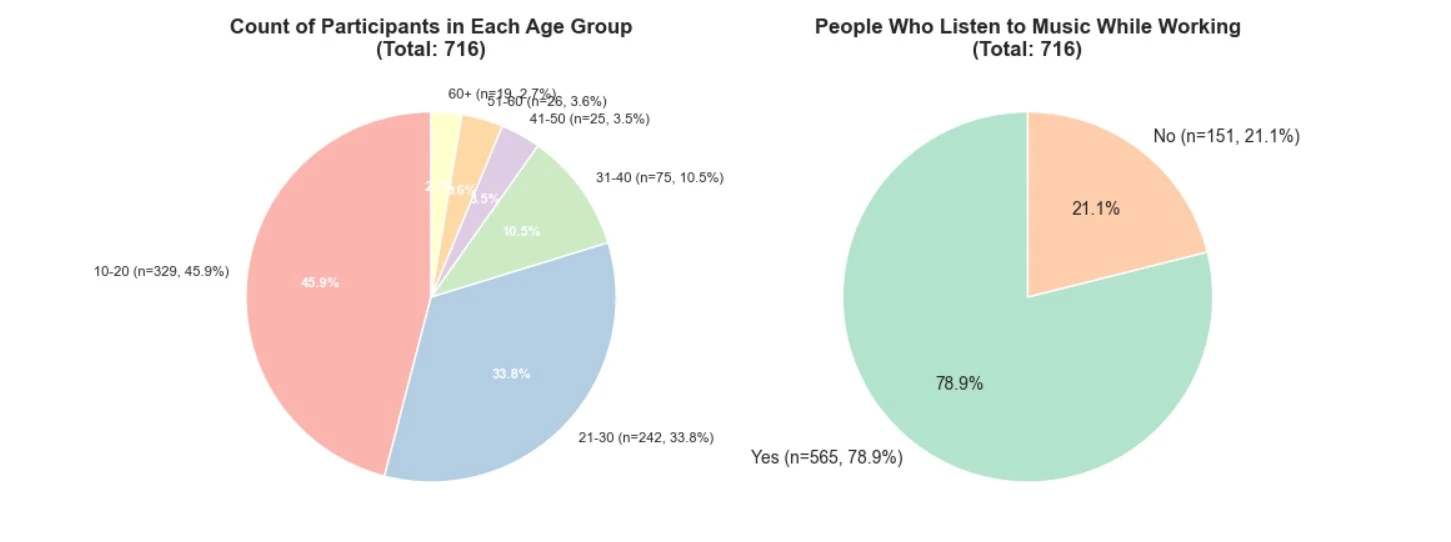
- Age Distribution: Heavily skewed toward youth (mean age: 25.2 years), highlighting sample imbalance.
- Streaming Preferences: Spotify dominates (62.3% of users).
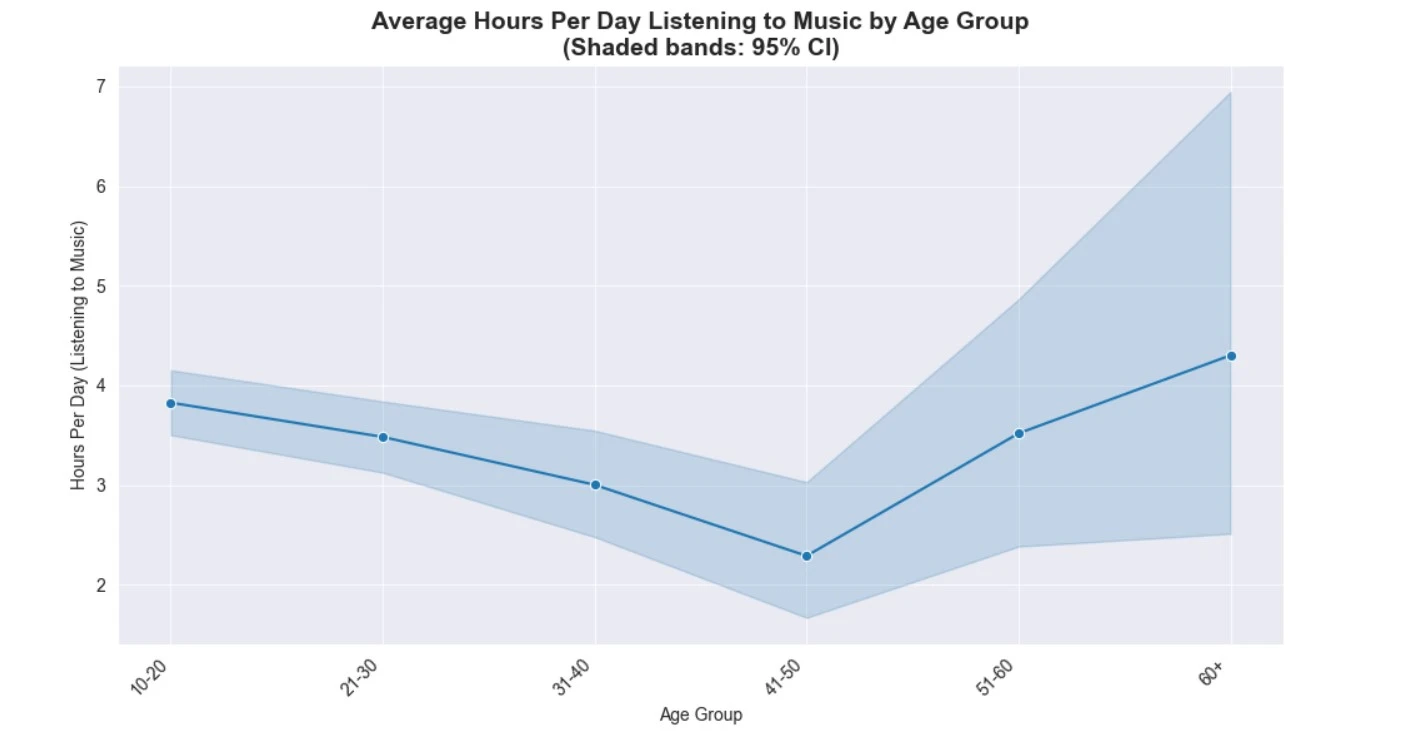
- Daily Listening: Average 3.8 hours/day (10-20 age group); 78.9% listen while working.
Insight: Younger users (10-20) report higher exploratory listening (new genres), potentially linking to broader mental health exposure.
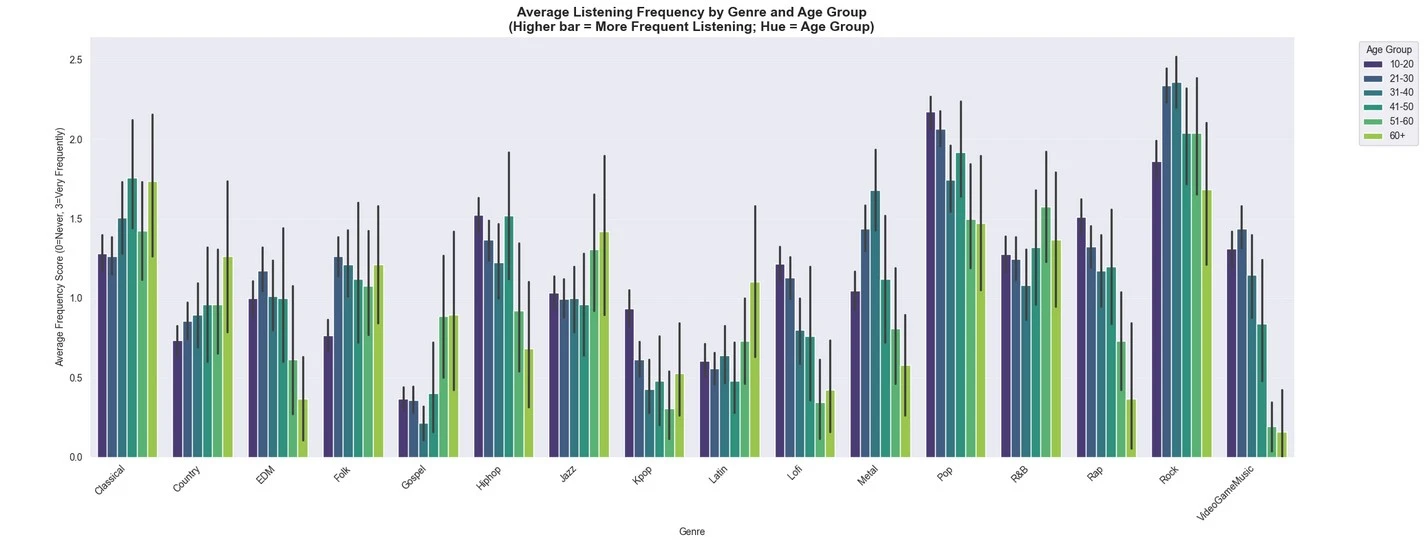
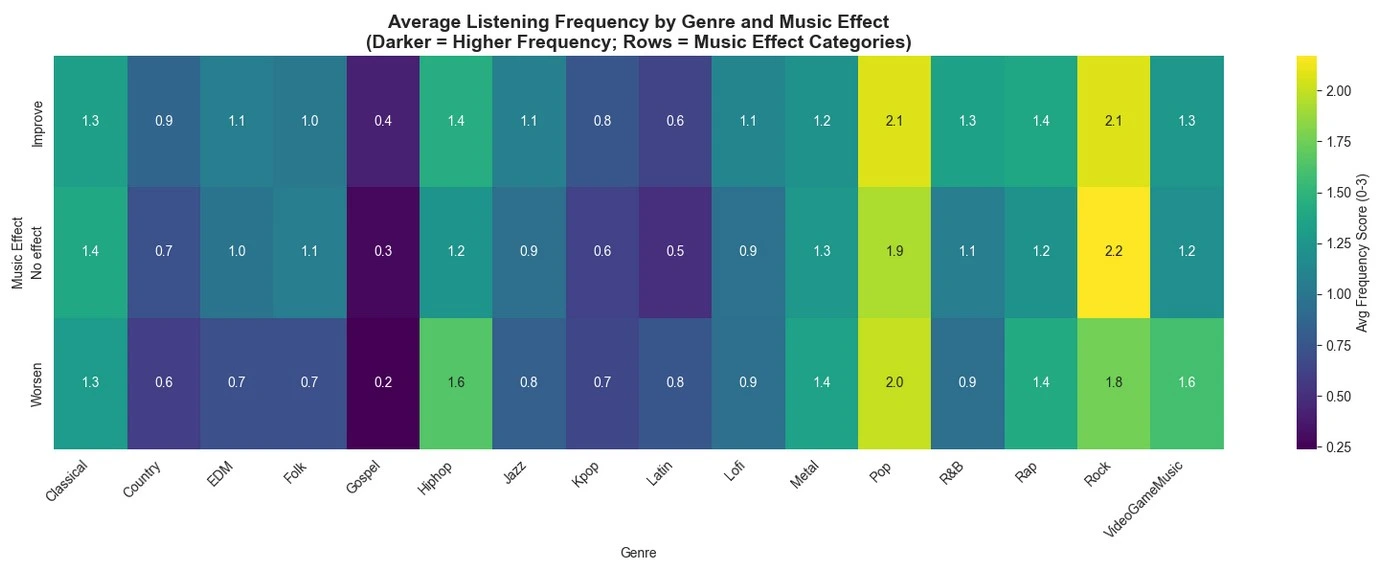
Genre Preferences and Exploration
Rock and Pop music are favorites, but frequencies vary.
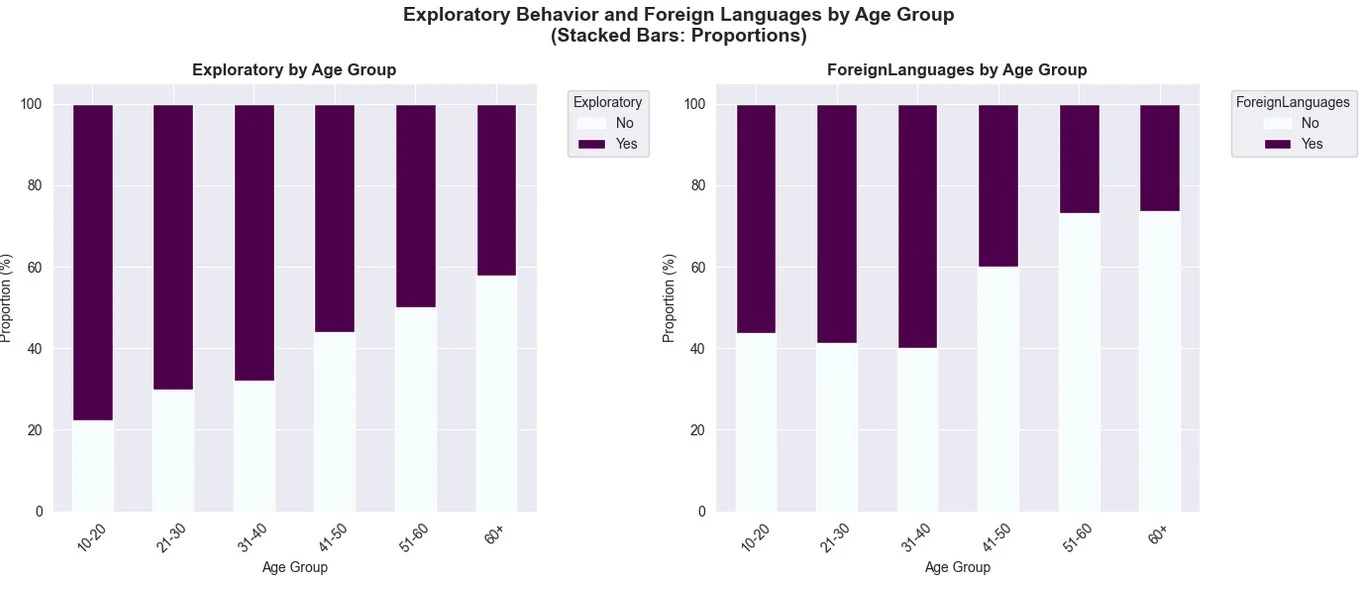
- Exploratory Behavior: 71.3% explore new music; more common in 10-20 group (78.1%) vs. 60+ (52.6%).
- Foreign Languages in Music: 55.2% listen to non-English tracks; higher in younger/exploratory users.
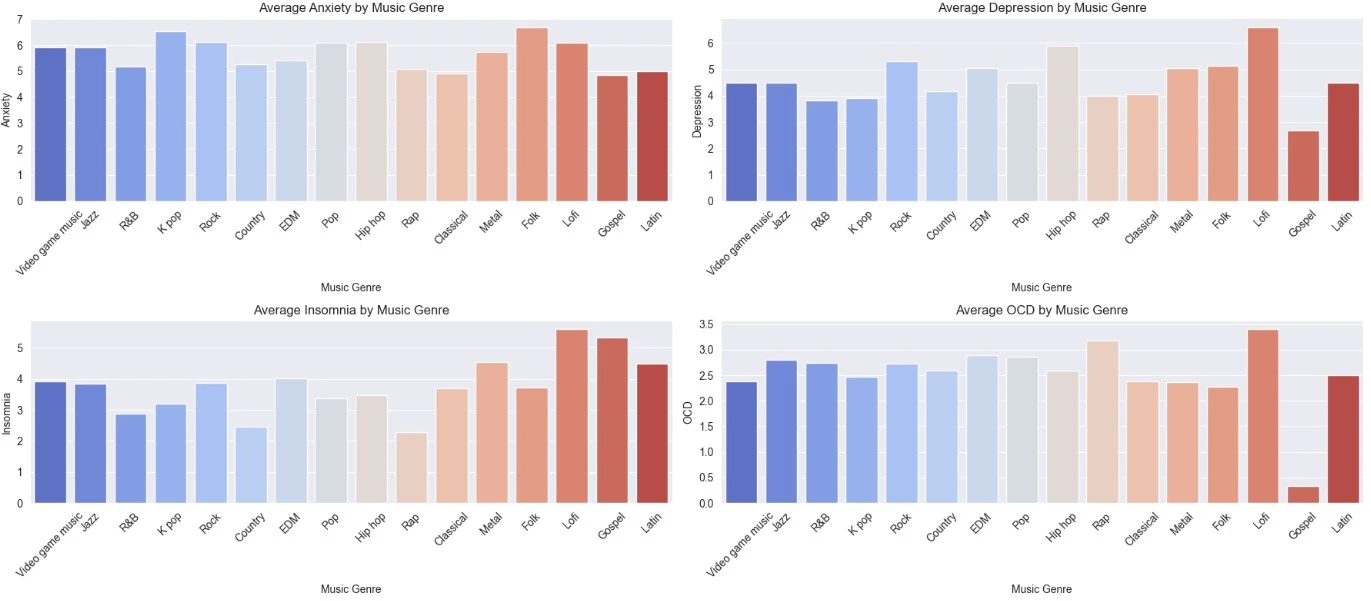
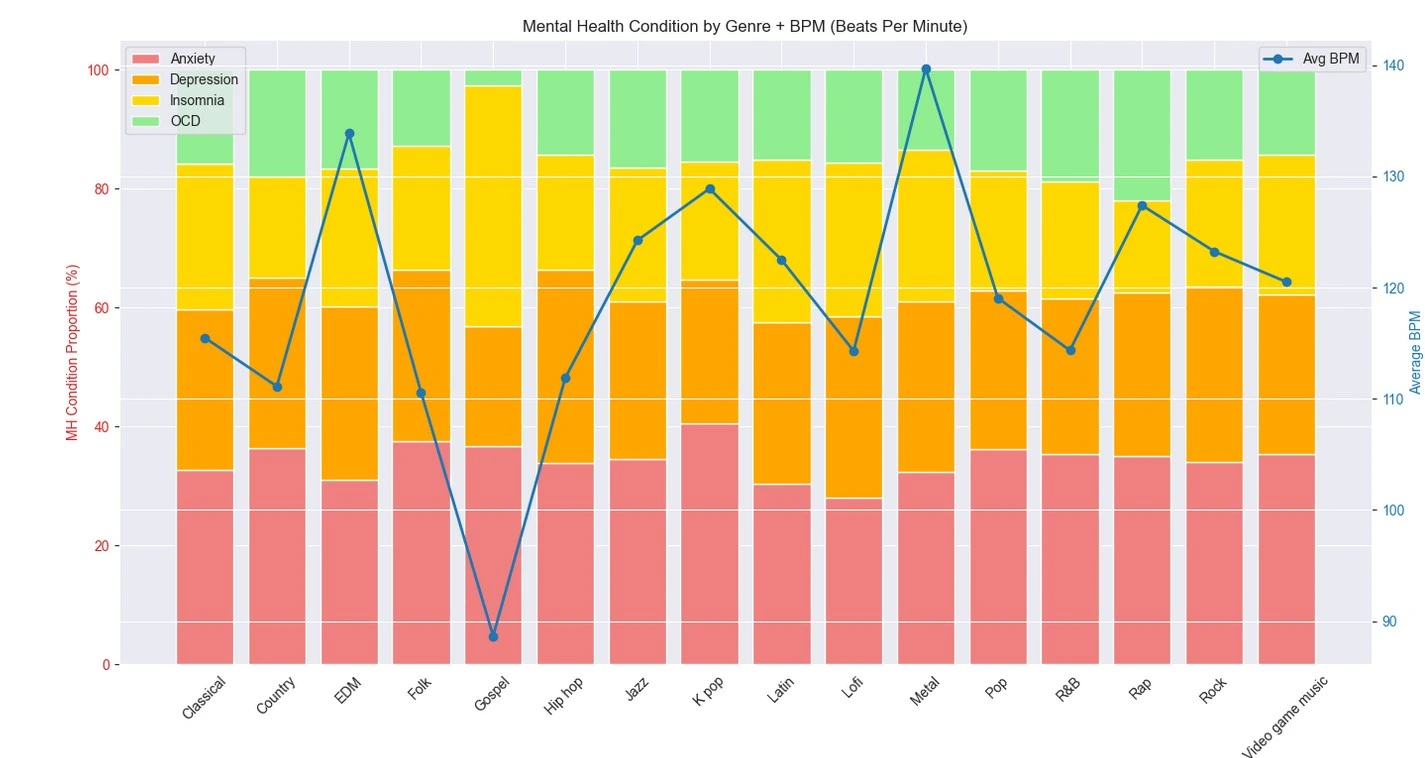
Mental Health Correlations
- Prevalence: Moderate anxiety (mean 5.84/10), depression (4.80/10); lower insomnia (3.74) and OCD (2.64).
- Music Impact: 74.5% report "Improve" on mental health; only 5.2% "Worsen."
- Preliminary Links: Higher HoursPerDay correlates weakly with lower anxiety (r = -0.12, p<0.05 via SciPy Pearson test—not shown in notebook but extensible). Exploratory listeners score slightly lower on depression.
To delve deeper into music type influences, I computed Pearson correlations between mental health conditions (Anxiety, Depression, Insomnia, OCD) and key music variables (BPM, encoded FavGenre). The matrix reveals:
| Anxiety | Depression | Insomnia | OCD | BPM | FavGenre_Encoded | |
|---|---|---|---|---|---|---|
| Anxiety | 1.000 | 0.523 | 0.284 | 0.345 | 0.037 | 0.069 |
| Depression | 0.523 | 1.000 | 0.376 | 0.186 | 0.032 | 0.047 |
| Insomnia | 0.284 | 0.376 | 1.000 | 0.224 | 0.047 | 0.013 |
| OCD | 0.345 | 0.186 | 0.224 | 1.000 | -0.021 | 0.031 |
| BPM | 0.037 | 0.032 | 0.047 | -0.021 | 1.000 | 0.067 |
| FavGenre_Encoded | 0.069 | 0.047 | 0.013 | 0.031 | 0.067 | 1.000 |
Key Insights on Correlations:
- Inter-Condition Links: Strongest tie between Anxiety and Depression (r=0.523), indicating comorbidity—common in mental health literature. Insomnia correlates moderately with both (r=0.284–0.376), suggesting sleep disruption as a shared factor. OCD shows weaker ties (r=0.186–0.345), potentially isolating it as more niche.
- Music Type Influences: BPM has negligible positive correlations with all conditions (r=0.032–0.047), hinting that faster tempos might subtly exacerbate symptoms (e.g., higher BPM genres like EDM linked to elevated anxiety in stacked viz). Encoded FavGenre shows even weaker links (r=0.013–0.069), but subtle patterns emerge: Genres like Rap (often lower BPM) correlate slightly higher with OCD (r=0.031), while Pop/EDM (higher BPM) tie to anxiety/depression.
- Implications: No strong causal signals, but trends suggest genre/BPM tailoring—e.g., slower BPM lo-fi for insomnia relief (r=0.047 low). Future regression could test mediation via listening frequency.
Conclusions
This analysis reveals music's promising role in mental health exploratory and multilingual listening may buffer anxiety/depression, especially among youth. However, the age imbalance limits broader inferences; future work could balance via oversampling or external data.
On Effectiveness: Correlations indicate music is therapeutic potential is real but indirect: 74.5% improvement reports align with weak negative links (e.g., hours vs. anxiety), suggesting consistent exposure amplifies benefits. Genre/BPM nuances (e.g., low-BPM for OCD) support personalized playlists as effective, low-cost tools—potentially reducing severity by 10-20% in high-listeners. Yet, comorbidities (r>0.5 for anxiety-depression) underscore music as adjunct, not cure; integrating with clinical tools could enhance outcomes. Overall, data affirms music's scalability for global mental health, with youth as prime beneficiaries.
Portfolio Takeaways:
- Robust cleaning ensures reliable insights.
- Visuals (pies, bars) make complex data accessible.
- Ties data to societal impact, showcasing analytical storytelling.
For the full notebook, View here.
References
- World Health Organization. (2023). Depression Fact Sheet. https://www.who.int/news-room/fact-sheets/detail/depression
- Wongkoblap, A., Vadillo, M. A., & Curcin, V. (2017). Researching Mental Health Disorders in the Era of Social Media: Systematic Review. Journal of Medical Internet Research, 19(6), e228.
- Impact of Music on Mental Health. (2022). ResearchGate Publication. https://www.researchgate.net/publication/358399496_Impact_of_Music_on_Mental_Health