Google & Apple Stock Price Analysis
Interactive Power BI Dashboard · Financial Insights (2005–2025)
Project at a Glance
A dynamic Power BI dashboard comparing Apple (AAPL) and Google (GOOGL) stock performance over 20 years. Explore volume trends, daily returns, cumulative gains, and risk via interactive slicers.
View on GitHubData & Scope
- Dataset: World Stock Prices (Kaggle, Yahoo Finance)
- Market: United States
- Companies: Apple (AAPL) & Google (GOOGL)
- Granularity: Daily (2005–2025)
Data Preparation
Transformed raw CSV in Power Query for precision:
- Split date/time via delimiter for hierarchies.
- Filtered to USA/Apple/Google only.
- Removed 0-volumes for log scaling.
- Added Daily Return Column:
DIVIDE([Close] - [Open], [Open])(% change). - Date filter: 2005–2025 (Google does not contain data before 2005).
Dataset Source
Tools & Skills
Key DAX Measures
Cumulative Return
Tracks overall gains/losses over time.
Cumulative Return =
VAR CurrentDate = MAX([Date])
RETURN
CALCULATE(
    SUM([Daily Return]),
    FILTER(
        ALL([Date]),
        [Date] <= CurrentDate
    )
)
Volatility Target
Target:
0.015Rolling Volatility
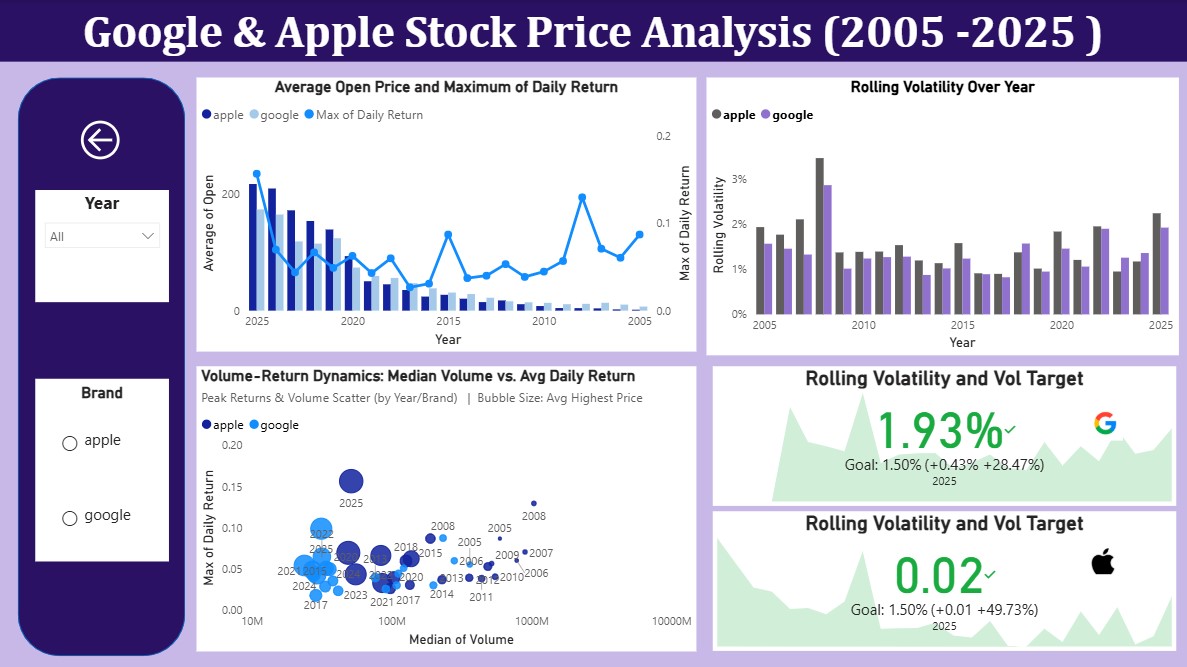
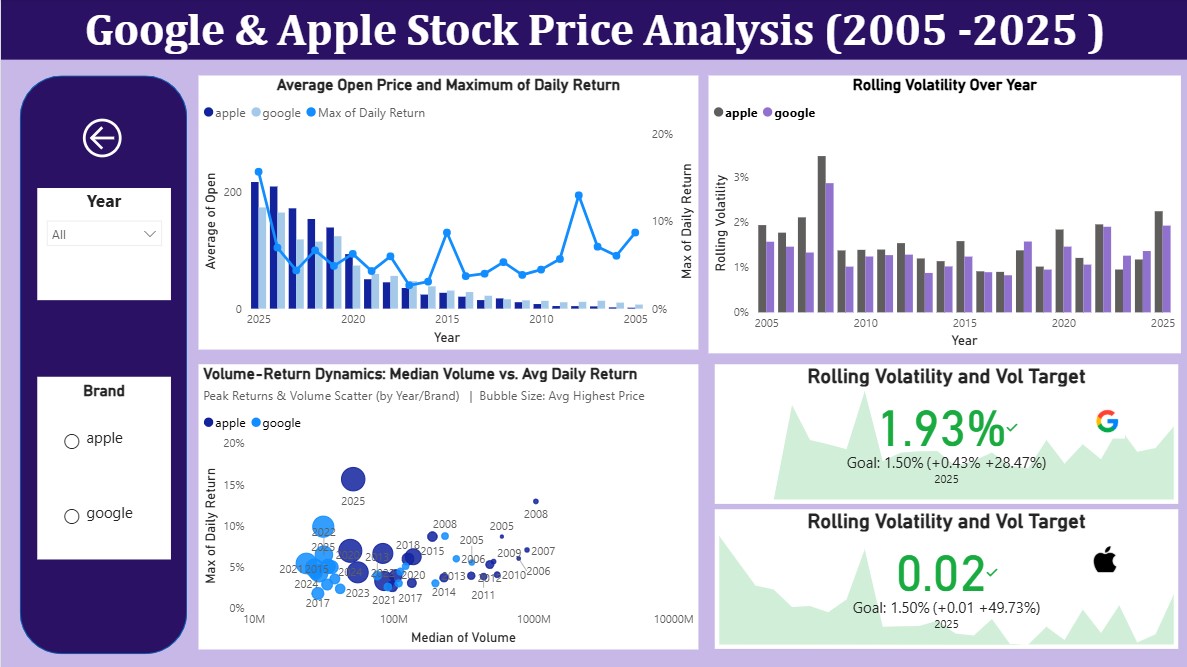
Implemented KPI cards to benchmark Apple and Google rolling volatility against a 1.5% target, enabling quick visual comparison of relative risk levels across time.
Rolling Volatility =
VAR CurrentDate = MAX('World-Stock-Prices-Dataset'[Date])
VAR LookbackDays = 252
VAR AvailablePeriod =
    CALCULATE(
        COUNTROWS('World-Stock-Prices-Dataset'),
        ALL('World-Stock-Prices-Dataset'[Date]),
        'World-Stock-Prices-Dataset'[Date] <= CurrentDate
    )
VAR ActualDays = MIN(LookbackDays, AvailablePeriod)
RETURN
IF(
    HASONEVALUE('World-Stock-Prices-Dataset'[Brand_Name]),
    IF(
        ActualDays >= 30,
        CALCULATE(
            STDEV.P([Daily Return]),
            ALL('World-Stock-Prices-Dataset'[Date]),
            DATESINPERIOD(
                'World-Stock-Prices-Dataset'[Date],
                CurrentDate,
                -ActualDays,
                DAY
            )
        ),
        BLANK()
    ),
    BLANK()
)
Std dev of daily returns over 252-day window (short-term risk). Dynamic for early years.
Key Insights
Declining Trading Volume
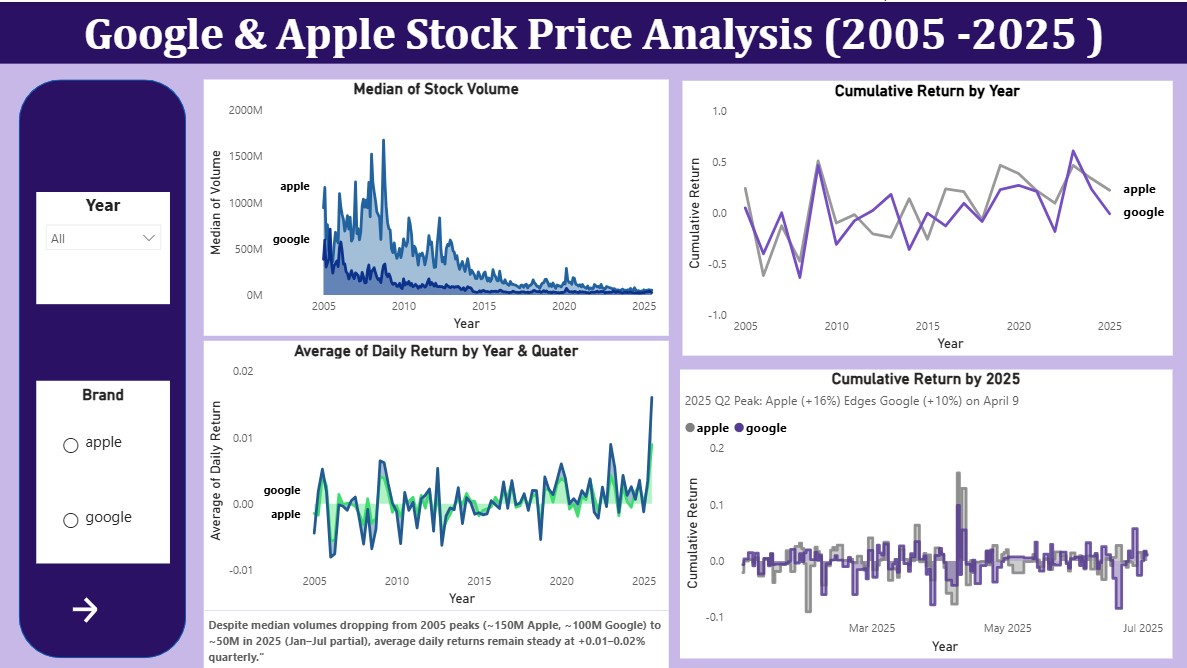
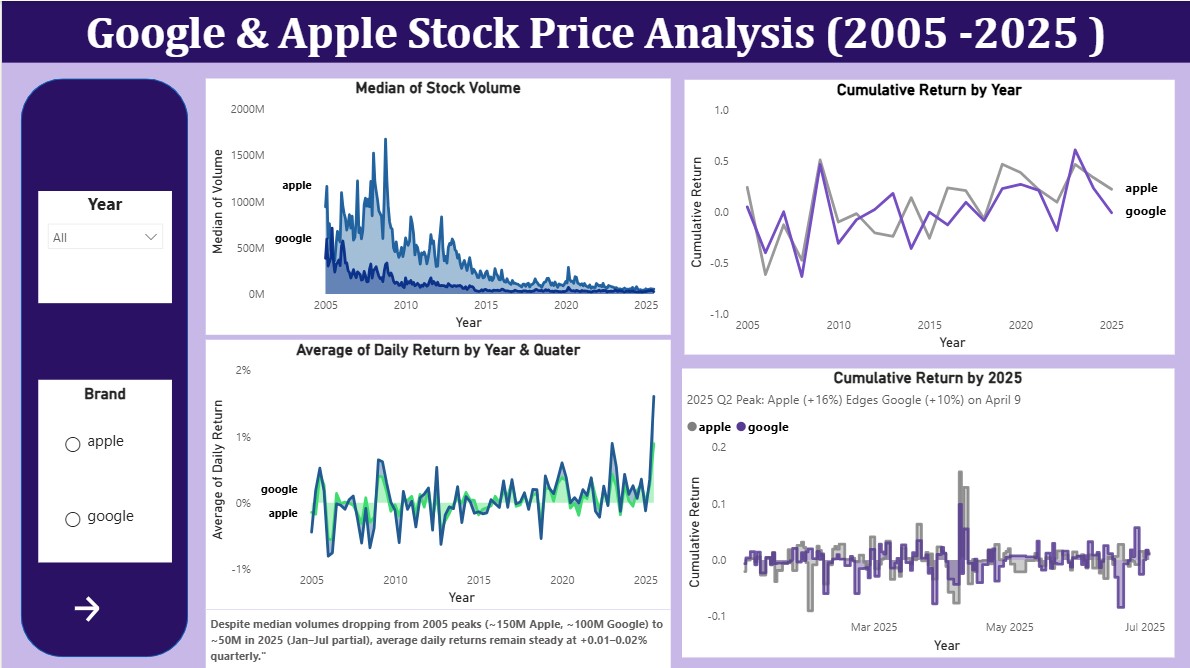
Trading volumes declined steadily from early highs (Apple ~150M, Google ~100M in 2005) to around ~50M by 2025 (partial data). This suggests market maturity and increased institutional trading rather than reduced investor interest.
Stable Daily Returns
Despite falling volumes, daily returns remained stable at approximately 0.01–0.02%. In 2025 (partial), Apple recorded a peak daily return of +0.16%, while Google peaked at +0.10%, indicating efficient price movement even with lower trading activity.
Strong Cumulative Performance
The highest cumulative returns were observed in Q2 2025, with Apple gaining approximately 16% and Google about 10%. This period highlights a strong rebound in the technology sector.
Market Risk & Volatility
Rolling volatility peaked during the 2008 financial crisis at around 3–4%. In contrast, volatility in 2025 stabilized near 2%, remaining slightly above the 1.5% target but well below crisis levels, indicating controlled market risk.
Note: 2025 data covers January–July only. Overall, Apple and Google show closely correlated price movements, with Apple demonstrating marginally higher return efficiency.