Toy Model Performance Analysis Dashboard
Interactive Power BI Dashboard · Sales & Business Insights
Project at a Glance
Comprehensive Power BI dashboard analyzing toy/scale model sales performance. Features custom DAX, advanced visuals, interactivity, seasonality insights, and strategic recommendations.
View on GitHubProject Overview
- This is a Power BI dashboard I built as part of a technical assignment for a job application. It uses the publicly available Classic Models sample dataset (toy/scale model wholesaler) to demonstrate skills in:
- - DAX measures (YoY growth, AOV, average discount % with AVERAGEX)
- - Data modeling & relationships
- - Visual storytelling (KPIs, trends, maps, top-N)
- - Interactivity (slicers, drill-through, filters)
- - Business insights & recommendations
- - Advanced visual features:trend lines, min/max/constant lines, X/Y constant lines, drill-through
-
*Dataset source: Classic Models sample database (widely used for learning)
*All design decisions, layout, calculations, and commentary are my own.
Data & Scope
- Dataset: Classic Models (toy/scale model wholesaler sample)
- Time Period: 2003–2005
- Granularity: Order-line level (~2,900 data rows)
- Key Areas: Revenue, Product Lines, Customers, Geography, Discounts, Seasonality
Data Preparation
Cleaned and transformed using:
- Power Query: Split columns, removed nulls where needed, standardized formats
- Python: Renamed all columns for consistency and clarity
- Kept nulls in State/Territory (meaningful geography)
Key DAX Measures
Average Discount %
AVERAGEX(
    'sales_data_clean',
    DIVIDE(
        'sales_data_clean'[MSRP] - 'sales_data_clean'[Price Each],
        'sales_data_clean'[MSRP],
        0
    )
)
Average Revenue Per Order (AOV)
DIVIDE([Total Sales], [Total Orders], 0)
Average Units per Order
DIVIDE(
    SUM('sales_data_clean'[Qty Ordered]),
    [Total Orders],
    0
)
Latest YoY Growth %
VAR LatestYear = MAX('sales_data_clean'[Year])
VAR SalesLatest = CALCULATE([Total Sales], 'sales_data_clean'[Year] = LatestYear)
VAR SalesPrev   = CALCULATE([Total Sales], 'sales_data_clean'[Year] = LatestYear - 1)
RETURN
    DIVIDE(SalesLatest - SalesPrev, SalesPrev, 0)
Total Orders
DISTINCTCOUNT('sales_data_clean'[Order No.])
Total Sales
SUM('sales_data_clean'[Sales])
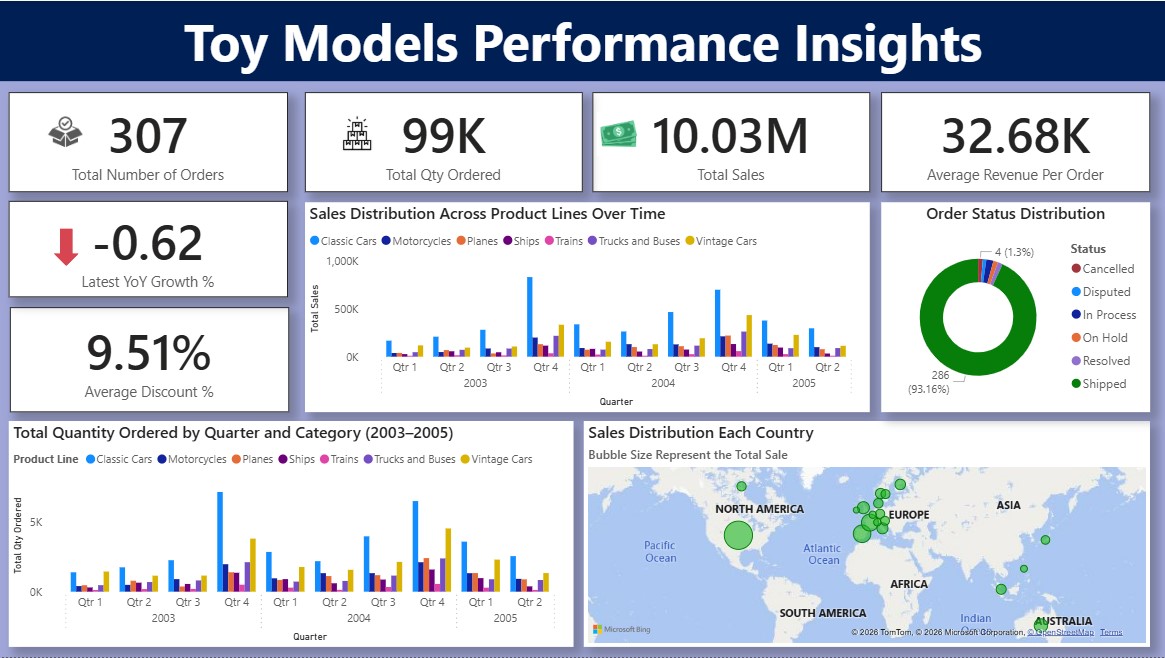
Key Insights
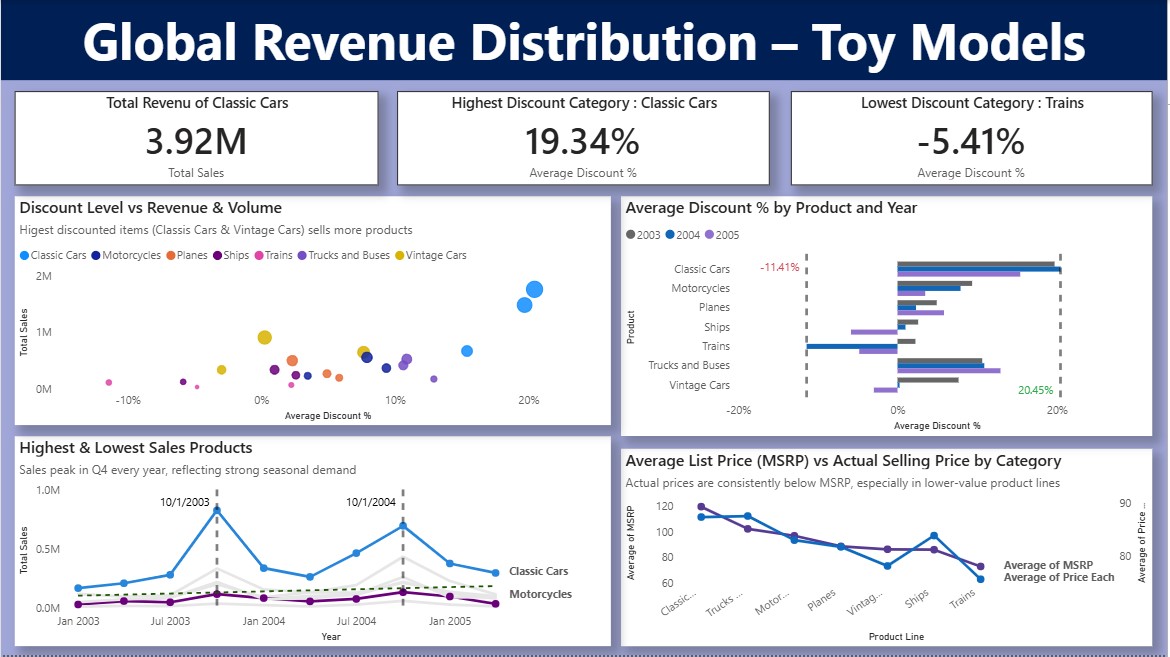
- Classic Cars drive around 45% of total revenue — core strength of the portfolio.
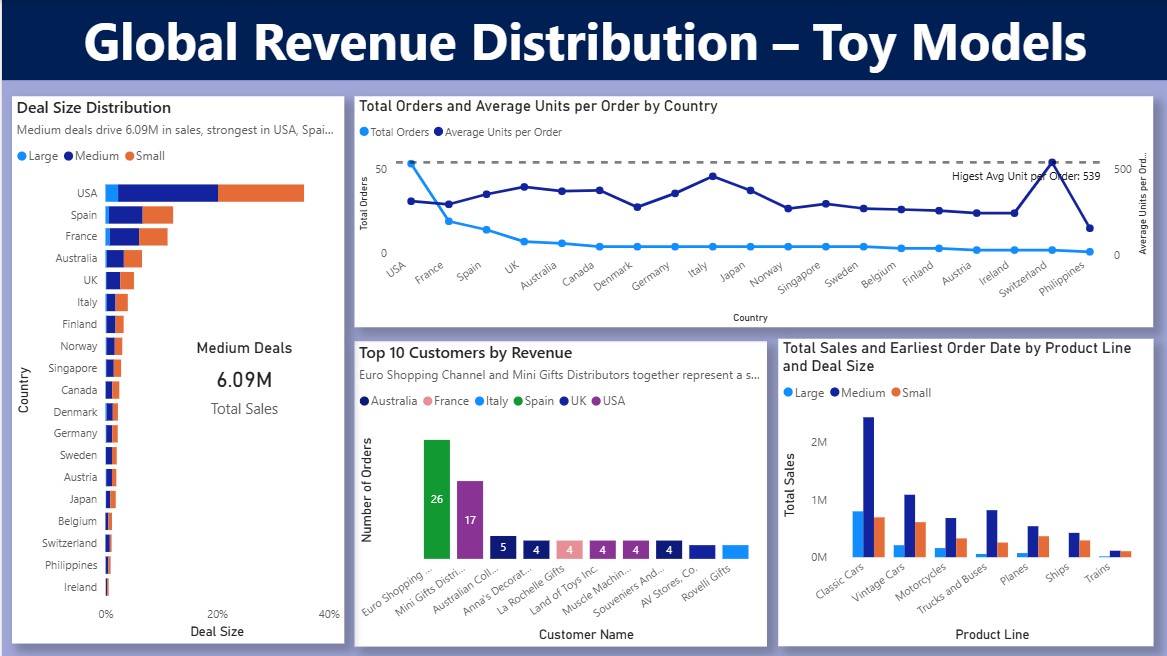
- Medium-sized deals generate the highest revenue (6.09M), led by USA, Spain, and France.
- Q4 consistently shows the strongest sales each year — clear holiday seasonality.
- Revenue heavily concentrated: Top 5 customers contribute highest values of total sales.
- Average discount of 9.51% is controlled, but reaches 20%+ in low-volume categories.
- Slight YoY decline (-0.62%) signals potential pricing or market pressure.
Actionable Recommendations
- Protect & invest in Classic Cars category – highest revenue driver with best pricing power.
- Review discount policy for Trains, Ships & niche lines – opportunity to reduce discounting and improve margins.
- Strengthen relationships with top 5 customers (Euro Shopping Channel, Mini Gifts, etc.) – loyalty program or dedicated account management to reduce concentration risk.
- Capitalize on Q4 seasonality – increase inventory & targeted promotions in October–December.
- Expand targeted marketing & sales efforts in growing European markets (France, Spain, UK).
- Monitor YoY trend closely – investigate causes of slight decline and adjust pricing/volume strategy.
- Increase production capacity & stock levels for Q4 to meet heightened holiday demand. Introduce fresh designs, seasonal themes, and limited-edition models to boost sales during the festive peak (October–December).
- In underperforming markets (e.g., lower-volume countries), perform customer research to understand preferences, then customize high-demand product lines (such as Classic Cars or Motorcycles) with region-specific features, designs, or editions to drive sales growth.