Project Details
Uber Ride Analytics Dashboard
Project Information
- Category: Data Analytics / Power BI
- Dataset: Uber Ride Analytics Dataset 2024 (Kaggle)
- Size: ~25 MB (148K rows)
- Region: NCR, India
- Scope: NCR-focused data covering Time, Booking Status, Ratings, Locations, and Ride Distance.
- Challenges: Over 50% nulls in cancellation-related fields and inconsistent status values.
- GitHub: View Repository
Project Highlight
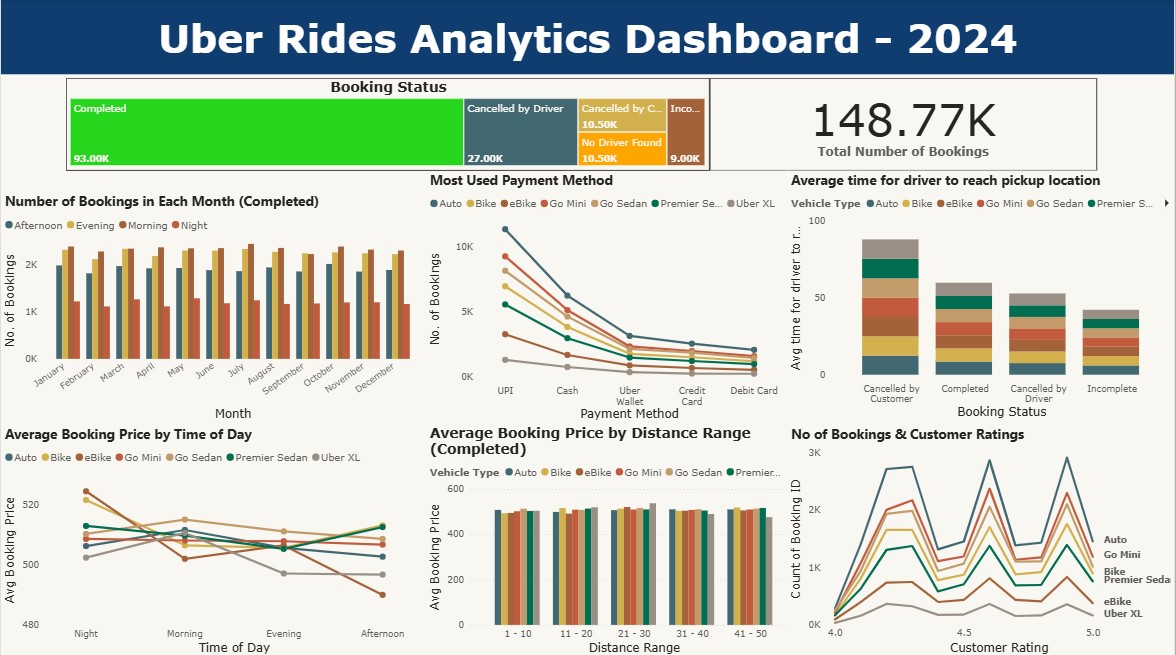
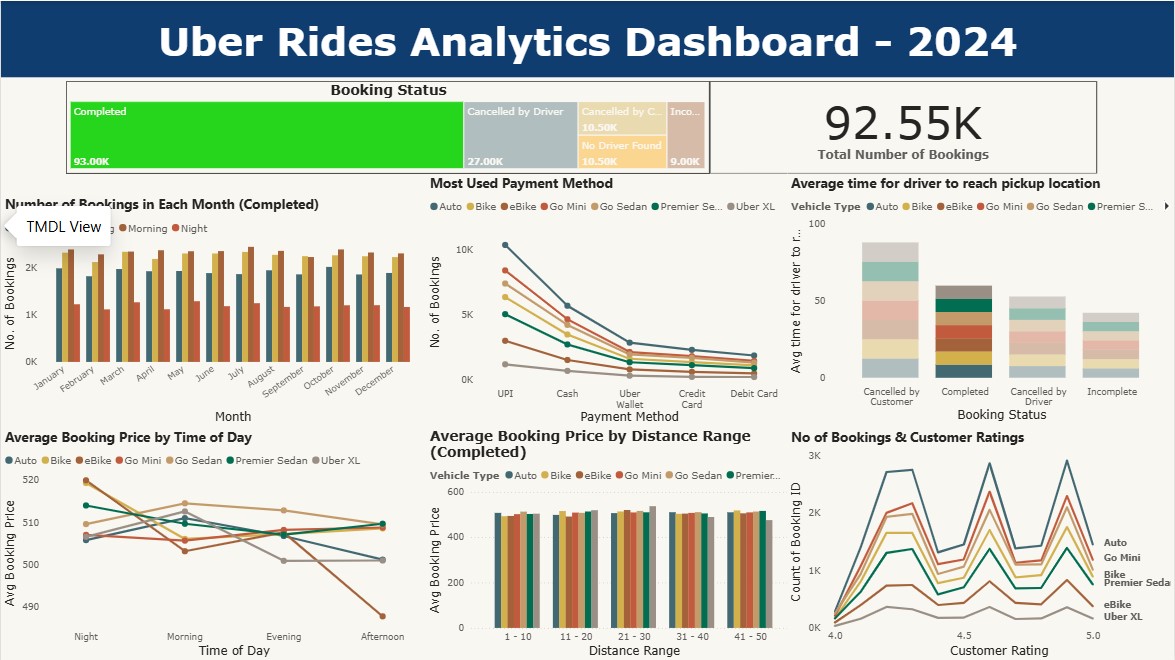
This interactive Power BI dashboard analyzes Uber ride data to uncover patterns in cancellations, peak hours, ride efficiency, and distance trends. The dashboard supports operational optimization and better decision-making.
Data Preparation & Modeling
Data Preparation:
Cleaned and transformed data using Power Query and DAX. Derived binary columns simplified mixed-status fields:
- Cancelled Rides by Driver
- Cancelled Rides by Customer
- Reason for Cancelling by Customer
- Driver Cancellation Reason
- Incomplete Rides
- Incomplete Rides Reason
Null handling was achieved using visual-level and page-level filters to avoid cascading row losses, preserving nearly 90% of the dataset.
DAX Calcluations
Segmented key metrics to identify behavioral and operational patterns:
- Time of Day – Categorized rides into Morning, Afternoon, Evening, and Night based on booking timestamps.
- Distance Range – Bucketed rides into 5 km increments up to 50 km for profitability and demand segmentation.
Time of Day =
VAR Hour = HOUR('Uber Ride Analytics Dataset 2024'[Time])
RETURN
SWITCH(
    TRUE(),
    Hour >= 5  && Hour < 12, "Morning",
    Hour >= 12 && Hour < 17, "Afternoon",
    Hour >= 17 && Hour < 21, "Evening",
    Hour >= 21 || Hour < 5,  "Night"
)
Distance Range =
SWITCH(
    TRUE(),
    'Uber Ride Analytics Dataset 2024'[Ride Distance] < 10, "1 - 10",
    'Uber Ride Analytics Dataset 2024'[Ride Distance] < 20, "11 - 20",
    'Uber Ride Analytics Dataset 2024'[Ride Distance] < 30, "21 - 30",
    'Uber Ride Analytics Dataset 2024'[Ride Distance] < 40, "31 - 40",
    'Uber Ride Analytics Dataset 2024'[Ride Distance] < 50, "41 - 50",
    "null"
)
This project demonstrates strong capability in Power BI, DAX, Power Query, and analytical storytelling.
Insights & Recommendations
Key Insights
-
Peak Demand Periods:
The highest number of completed bookings occur during the morning and evening hours, aligning with peak commuting times. These periods represent the busiest operational windows for Uber drivers. -
Pricing Patterns by Time of Day:
Average booking prices are highest during night-time, reflecting surge pricing driven by demand. Daytime prices show relatively moderate variation. -
Price Sensitivity to Distance:
Booking prices show minimal variation across distance ranges, indicating that pricing is influenced more by demand, time, and vehicle type rather than distance alone. -
Preferred Payment Method:
UPI dominates as the most-used payment method, highlighting strong user preference for fast and digital payment solutions. -
Ride Cancellations & Pickup Time:
A significant number of customer cancellations occur when the driver pickup time is high, making wait time a critical driver of customer satisfaction.
Recommendations
-
Driver Allocation Optimization:
Improve driver availability during morning and evening peak hours through dynamic scheduling and targeted incentive programs to reduce wait times. -
Reducing Pickup Delays:
Implement smarter driver–passenger matching algorithms prioritizing proximity, along with real-time reassignment when pickup times exceed acceptable thresholds. -
Night-Time Pricing Strategy:
Enhance pricing transparency and introduce off-peak discounts or loyalty incentives to balance night-time demand. -
Enhancing Digital Payments:
Leverage UPI dominance by offering UPI-exclusive promotions and ensuring high transaction reliability to strengthen user trust.